
The following resources and tools have been compiled by consortium members as part of the standardization working group. These resources and tools can be used as guidance for researchers and other stakeholders interested in summarizing and visualizing patient tolerability data:
On This Page
- All Heading 2s will automatically be pulled in to this list.
- Do not edit the content on this template.
Selected Scoring and Summary Measures
Table 1 includes a list of scoring and summary measures developed by the NCI Moonshot consortium with the purpose of summarizing and analyzing patient tolerability data. A short description of each measure and links to the primary reference and additional resources and applications are included in the table. Codes to calculate and apply the scores are available in Table 2.
Table 1. Scoring and Summary Measures*
| Scoring and summary measures | Description | References and Resources |
|---|---|---|
Composite grade 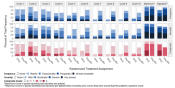
| Composite grading algorithm mapping PRO-CTCAE® symptom item attributes to a single numerical grade to align with other standardized tools assessing adverse events. | Reference
|
Toxicity index 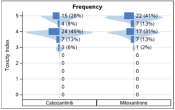
| Summary measure of CTCAE and PRO-CTCAE® data that accounts for frequency and burden of toxicities and preserves the ranking of the toxicities. | Reference
|
| Baseline adjusted maximum grade | Summary measure which accounts for pretreatment symptomatic burden or pre-existing adverse events. | Reference
Resources/examples
|
Table 2 includes a list of publicly available programming and codes, visualization tools, guides, and patient-facing material developed by the Moonshot Consortium members. Additional information, recommendations, and software requirements can be accessed through the links. References to publications and examples of applications are also provided.
Table 2. Publicly available programming, guides, and related tools for use with PRO-CTCAE®
| Description | Link |
|---|---|
| ProAE: A collection of tools to facilitate standardized analysis and graphical procedures when using PRO-CTCAE® (available in SAS and R programming languages). Scoring applications, statistical tables, graphical approaches, summary measure applications, and missing data analysis approaches are available. | R package https://cran.r-project.org/web/packages/ProAE/index.html SAS macros https://github.com/biostatgirl/ProAE |
ToxT: Methods and tools to analyze toxicity and patient-reported data over time (available in SAS) 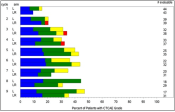
| SAS macros
|
visae: Implementation of Shiny app to visualize adverse events based on the Common Terminology Criteria for Adverse Events using stacked correspondence analysis (available in R). 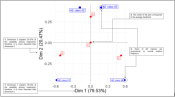
| R package
|
ShinySankey: Example of a Sankey diagram to visualize toxicity and QOL data by treatment type and over time (available in R). 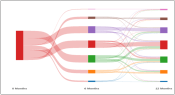
| R code
|
Color Schemes for graphical displays 
| R package |
| Guidelines for evaluating impacts of missing data | Resources/examples
|
Color Schemes Recommendations
A survey was conducted among 60 consortium members to understand respondents’ preferences in color schemes of various figures displaying drug tolerability data. Based on 60 responses of preferences of consortium members, the following observations and recommendations were made:
- Respondents prefer the blue/red gradient when considering aesthetics (Figure 1)
- Respondents prefer the multicolored/contrasting for ease of distinguishing between groups and between severity/frequency (Figure 2)
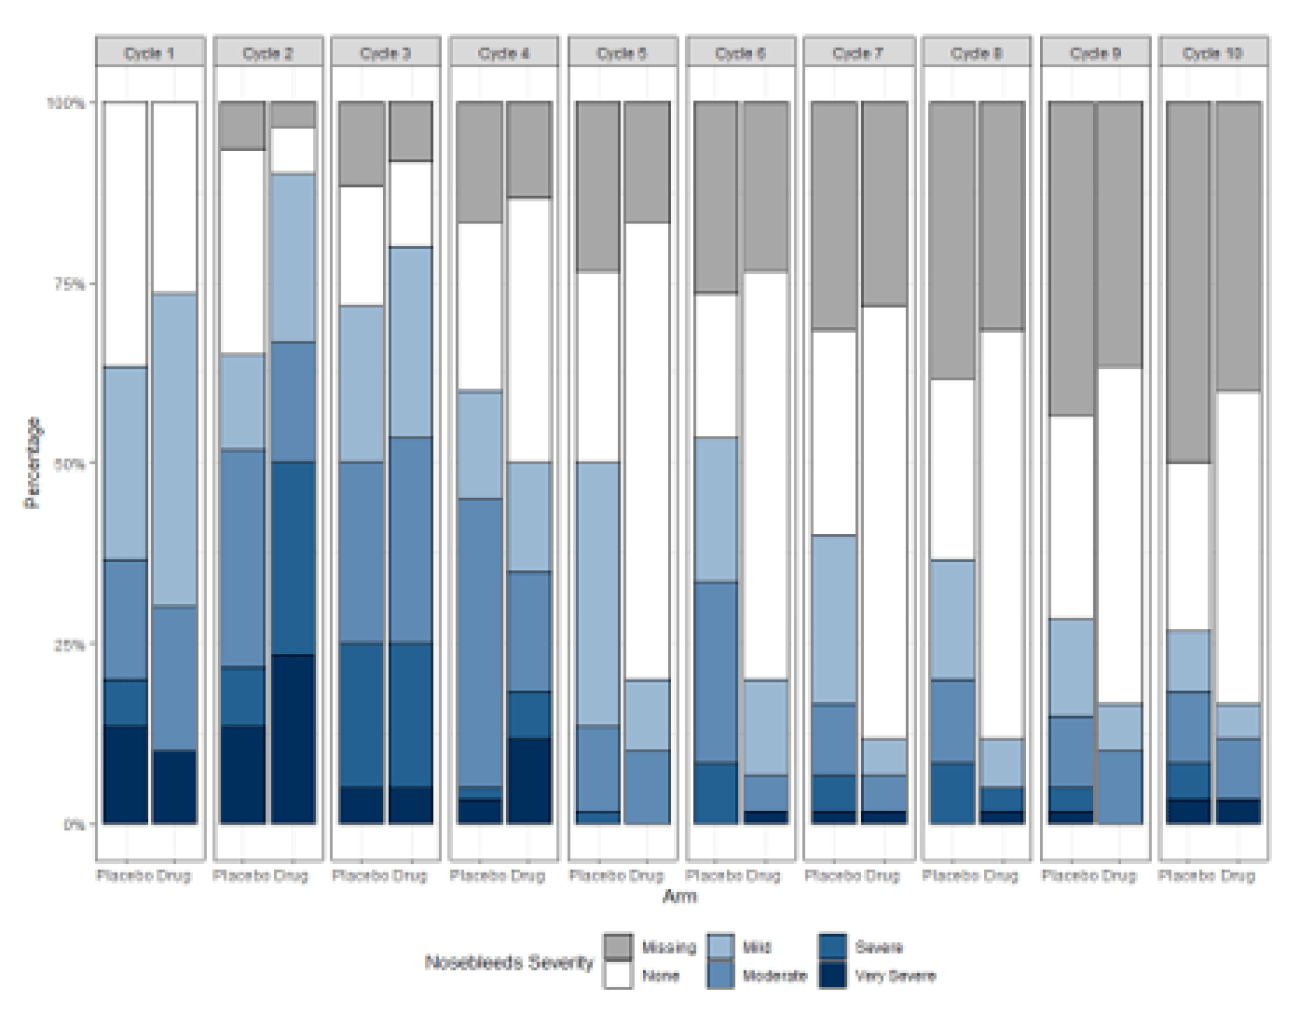
- Most respondents prefer to show the missing data in gray over reporting sample sizes for ease of understanding missing data, though this was not a unanimous or near-unanimous preference. (Figure 3)
Figure 1. Stacked Bar Chart - Blue and Red Gradient

Figure 2. Vertical Butterfly Plots
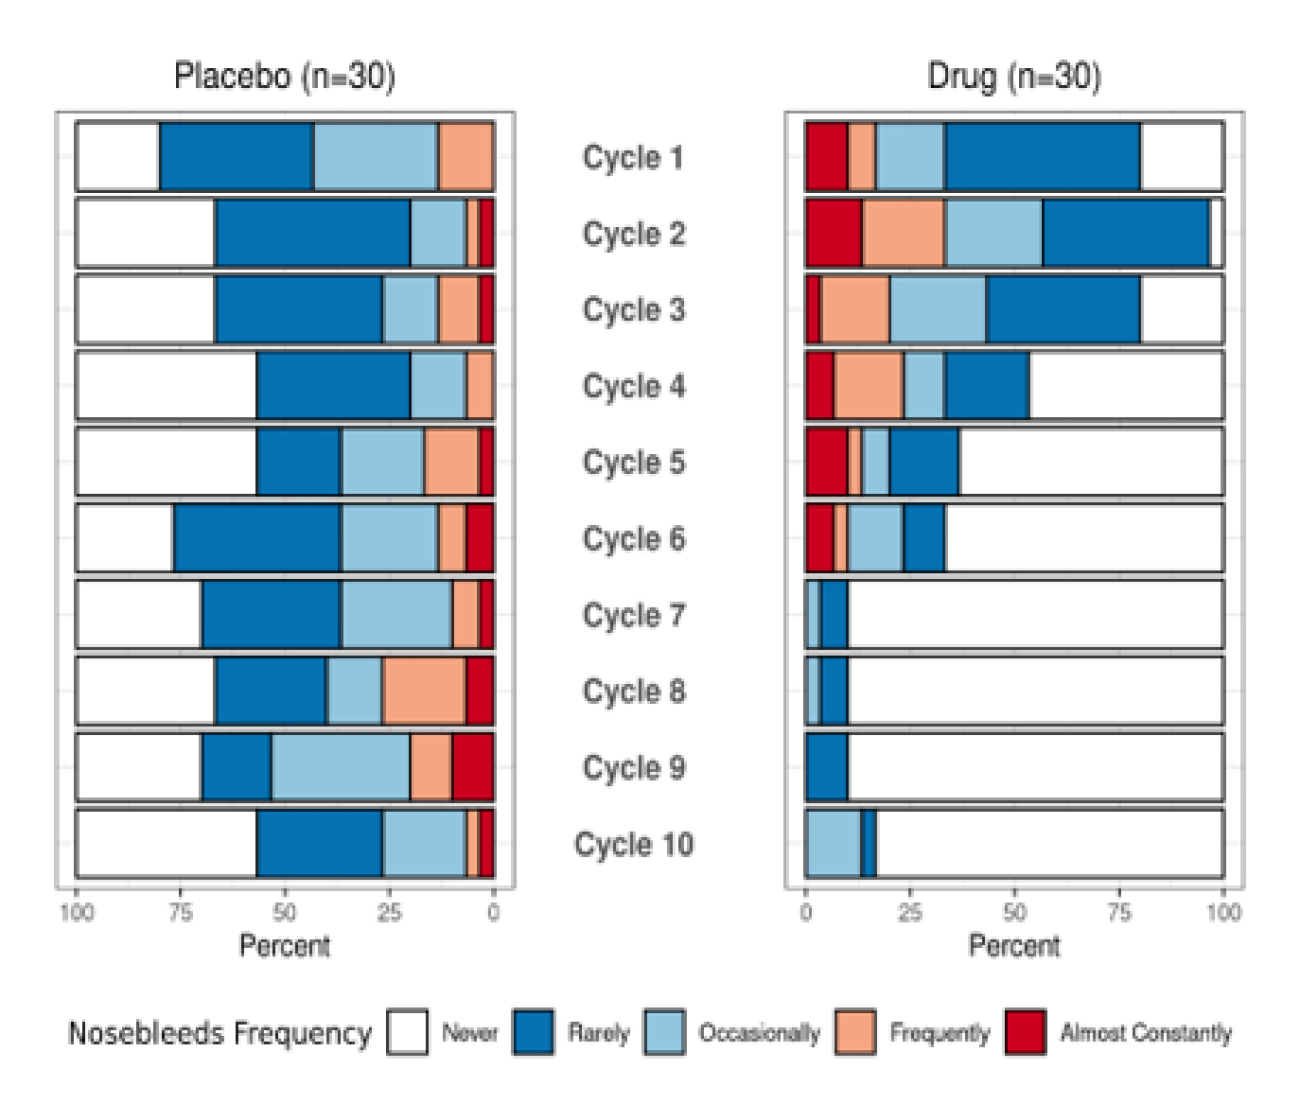
Figure 3. Graphical Representation of Missing Data
Other PRO and PRO-CTCAE® related resources
| Description | Link(s) |
|---|---|
| PRO-CTCAE® and PED-PRO-CTCAE® Patient-reported outcome measurement system developed by the National Cancer Institute to capture symptomatic adverse events in patients on cancer clinical trials. | PROCTCAE® PED-PRO-CTCAE® |
| PROTEUS: Patient-Reported Outcomes Tools: Engaging Users & Stakeholders The PROTEUS Consortium promotes tools and resources to optimize the use of patient-reported outcomes (PROs) in clinical trials to ensure that patients, clinicians, and other decision-makers can make the best decisions about treatment options. | https://theproteusconsortium.org/ |
| SISAQOL Setting International Standards in Analyzing Patient-Reported Outcomes and Quality of Life Endpoints Data. | https://qol.eortc.org/projectqol/sisaqol/ |
| CDISC: Clinical Data Interchange Standards Consortium The Clinical Data Interchange Standards Consortium is a standards developing organization dealing with medical research data linked with healthcare, to "enable information system interoperability to improve medical research and related areas of healthcare". | https://www.cdisc.org/standards |
| FDA Project patient voice Online platform for patients and caregivers to access patient-reported symptom data from cancer clinical trials of FDA-approved products. | https://www.fda.gov/about-fda/oncology-center-excellence/project-patient-voice |
| Oncology Center of Excellence Patient Focused Drug Development (OCE PFDD) Program focused on engagement and education, research and science, and regulatory and policy in collaboration with FDA Centers and external stakeholders involved in patient-reported outcome research in oncology. | https://www.fda.gov/about-fda/oncology-center-excellence/patient-focused-drug-development |
| Center for Drug Evaluation and Research (CDER) patient-focused drug development (PFDD) program and guidance series Program goal to incorporate patient’s voice into drug development and evaluation and provide guidance on the collection of patient input, methods to identify what is important to patients, the selection, development and modification of clinical outcome assessment and incorporation of clinical outcome assessments into endpoints for regulatory decision-making. | https://www.fda.gov/drugs/development-approval-process-drugs/cder-patient-focused-drug-development |
| Pediatric Oncology Subcommittee of the Oncologic Drugs Advisory Committee Meeting (May 2021) Meeting information and event materials from the ODAC that discussed the development and implementation of the PED-PRO-CTCAE® tool for including the patient’s voice and assess tolerability and toxicity in oncology trials. | https://www.govinfo.gov/app/details/FR-2021-04-13/2021-07546/context |
| NCI Common Terminology Criteria for Adverse Events (CTCAE): A descriptive terminology which can be utilized for adverse event reporting. A grading scale is provided for each adverse event term. | https://dctd.cancer.gov/research/ctep-trials/trial-development |